Support our educational content for free when you purchase through links on our site. Learn more
Jacksonville Demographics Map (2026): 15 Insights That Reveal Jax’s True Colors 🌈
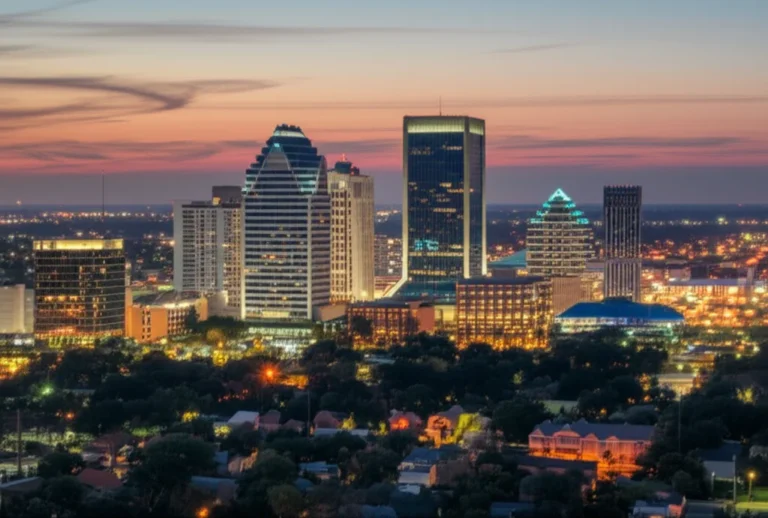
Ever wondered what Jacksonville really looks like beneath the surface? Beyond the beaches and bustling downtown, the city is a vibrant mosaic of cultures, ages, and neighborhoods — all captured in the fascinating data of Jacksonville’s demographics map. From historic shifts in population to the latest growth corridors, this guide dives deep into the numbers and colorful maps that tell the story of who calls Jax home.
Did you know Jacksonville’s Black population is nearly double the Florida state average? Or that the city’s Hispanic community has surged by over 50% in the last decade? Stick around, because later we’ll unpack neighborhood hotspots, reveal surprising economic patterns, and even explore how urban heat maps connect to demographics in ways you might never have imagined. Whether you’re a curious resident, a business owner, or a city planner, these 15 insights will change how you see the River City forever.
Key Takeaways
- Jacksonville is Florida’s largest city by land and population, with nearly 950,000 residents.
- The city’s racial makeup is diverse: White (47.8%), Black (29.9%), Hispanic (11.6%), Asian (5%), and growing multiracial communities.
- Neighborhoods like San Marco, Northside, and Arlington each have distinct demographic profiles shaping culture and economy.
- Age distribution skews younger than the national average, impacting schools and workforce dynamics.
- Economic disparities exist, with wealth concentrated in coastal and southern neighborhoods, while pockets of poverty remain in urban cores.
- Interactive demographic maps and official city ward maps are essential tools for understanding Jacksonville’s evolving landscape.
Ready to explore the true colors of Jacksonville? Let’s dive in!
Table of Contents
- ⚡️ Quick Tips and Facts: Your Jax Demographics Snapshot
- 🗺️ Unpacking Jacksonville’s Demographic Tapestry: A Historical Perspective
- 🤔 Why Do Jacksonville Demographics Matter? Beyond Just Numbers
- 🔍 Decoding the Map: How to Read and Understand Jacksonville’s Population Distribution
- 🏡 The Mosaic of Cultures: Exploring Jacksonville’s Diverse Ethnic and Racial Makeup
- The Majority View: Unpacking Jacksonville’s White Population Distribution
- The River City’s Rich Roots: Understanding Jacksonville’s Black Population Patterns
- From Far East to First Coast: Jacksonville’s Growing Asian Communities
- ¡Hola, Jax!: The Vibrant Growth of Jacksonville’s Hispanic/Latino Population
- Echoes of the Past, Voices of Today: Native American and Other Populations in Jacksonville
- Blended Identities: The Rise of Multiracial Residents in Jacksonville
- 👶👵 Generations of Jax: Age Demographics and Their Impact on Community Life
- 💰 The Economic Landscape: Income Brackets and Wealth Distribution Across Jacksonville
- 🎓 Brains and the Beaches: Educational Attainment Across Duval County
- 👨 👩 👧 👦 Families, Singles, and Everything In Between: Household Structures in Jax
- 🏠 Where We Live and How We Move: Housing Trends and Commuter Demographics
- 📍 Neighborhood by Neighborhood: A Deep Dive into Jacksonville’s Demographic Hotspots
- 📈 Growth Corridors and Changing Landscapes: Where Jacksonville is Expanding and Why
- 🏫🛍️ The Impact of Demographics on Local Life: From Schools to Shopping and Beyond
- 🔮 Planning Our Future: How Demographics Shape Jacksonville’s Development and Vision
- 📊 Navigating the Data: Where to Find Reliable Jacksonville Demographic Maps and Statistics
- ✅ Conclusion: The Ever-Evolving Face of the River City
- 🔗 Recommended Links for Further Exploration
- ❓ FAQ: Your Burning Questions About Jacksonville Demographics Answered
- 📚 Reference Links: Our Sources for Jax Facts™
⚡️ Quick Tips and Facts: Your Jax Demographics Snapshot
Welcome to the ultimate guide on Jacksonville demographics maps! If you’ve ever wondered how the River City’s population breaks down by race, age, income, or neighborhood, you’re in the right place. As local experts at Jax Facts™, we’ve dug deep into the numbers, maps, and trends to bring you a comprehensive, colorful, and downright fascinating portrait of Jacksonville, Florida.
Jacksonville at a Glance
- Population (2020 Census): ~949,611 residents, making Jax the largest city by population and land area in Florida. (Check out our related article on How Big Is Jacksonville Compared to Other Cities? The Surprising Truth (2026) 🌆)
- Racial/Ethnic Breakdown:
- White: 47.8%
- Black or African American: 29.9%
- Hispanic/Latino: 11.6%
- Asian: 5.0%
- Native American/Other: 1.0%
- Multiracial: 4.6%
- Median Age: ~35.5 years
- Households: 311,064 with an average size of 2.55 people
Why This Matters
Understanding Jacksonville’s demographics isn’t just about trivia. It shapes everything from school planning to business development, political representation, and even where you might want to buy your next home. Plus, it’s a window into the city’s evolving culture and identity.
Quick Fact Table: Jacksonville vs. Florida Averages
| Demographic Group | Jacksonville % | Florida % | Notes |
|---|---|---|---|
| White | 47.8% | 51.5% | Slightly below state average |
| Black or African American | 29.9% | 14.5% | Significantly higher than Florida |
| Hispanic/Latino | 11.6% | 26.5% | Lower than state average |
| Asian | 5.0% | 2.9% | Above state average |
| Native American/Other | 1.0% | 0.9% | Similar to state average |
| Multiracial | 4.6% | 3.7% | Slightly above state average |
Pro Tip from Jax Facts™
If you’re a data nerd or just curious, the U.S. Census Bureau’s data.census.gov is your go-to for the freshest, official stats. For a visual feast, try the Census Dots racial maps that color-code population by race — it’s like a living mosaic of our city!
🗺️ Unpacking Jacksonville’s Demographic Tapestry: A Historical Perspective
Jacksonville’s demographic story is a rich tapestry woven over centuries — from its Native American roots to European settlement, the Civil War era, and waves of migration that shaped its modern diversity.
Early Days and Population Growth
- Originally inhabited by the Timucua people, the area that became Jacksonville saw European settlers arrive in the 16th century.
- Post-Civil War, Jacksonville grew as a transportation hub, attracting African American populations during the Great Migration.
- The city’s annexation of surrounding areas in the 1960s dramatically increased its land area and population, creating the sprawling metropolis we know today.
Shifting Demographics Over Time
- The White population was dominant for much of the 20th century but has declined from 75.8% in 1970 to 47.8% in 2020.
- African American residents have consistently made up a significant portion, now nearly 30%.
- Hispanic and Asian populations have grown steadily, reflecting broader national immigration trends.
Why History Matters for Today’s Map
Understanding these shifts helps explain why certain neighborhoods have distinct cultural identities and how economic and social policies have influenced settlement patterns.
🤔 Why Do Jacksonville Demographics Matter? Beyond Just Numbers
You might ask, “Why should I care about these demographics maps?” Well, here’s the scoop:
- Urban Planning & Services: City officials use demographic data to allocate resources — from schools and hospitals to parks and public transit.
- Business Decisions: Retailers and entrepreneurs analyze population trends to decide where to open stores or target marketing.
- Political Representation: Voting districts and ward boundaries rely on demographic info to ensure fair representation.
- Community Identity: Demographics shape cultural festivals, language services, and neighborhood character.
For example, the Jacksonville City Council uses ward maps to balance population and diversity across districts, ensuring your voice counts.
🔍 Decoding the Map: How to Read and Understand Jacksonville’s Population Distribution
Jacksonville’s demographic maps can look like a colorful puzzle at first glance. Here’s how to make sense of them:
Dot Density Maps
- Each dot often represents a fixed number of people (e.g., 25).
- Dots are color-coded by race or ethnicity.
- Clusters indicate population density and racial concentration.
Choropleth Maps
- Areas shaded by color intensity to show percentages or counts of a demographic group.
- Useful for spotting trends like where Hispanic populations are growing or where income levels vary.
Interactive Tools
- Websites like Census Dots and City-Data offer interactive maps.
- You can zoom in on neighborhoods like Riverside, San Marco, or Arlington to see detailed demographic breakdowns.
Tips for Interpretation
- Look for patterns: Are certain groups clustered or dispersed?
- Consider scale: Citywide maps show big trends, but neighborhood maps reveal local nuances.
- Remember context: Demographics interact with geography, economy, and history.
🏡 The Mosaic of Cultures: Exploring Jacksonville’s Diverse Ethnic and Racial Makeup
Jacksonville’s charm lies in its diversity. Let’s explore the major groups that make up the city’s vibrant population.
The Majority View: Unpacking Jacksonville’s White Population Distribution
- 47.8% of residents identify as White (non-Hispanic).
- Predominantly found in neighborhoods like San Marco, Mandarin, and parts of the Beaches.
- The White population has declined over recent decades but remains the largest single group.
- Many residents trace ancestry to German, Irish, and English roots, reflecting historical migration patterns.
The River City’s Rich Roots: Understanding Jacksonville’s Black Population Patterns
- African Americans constitute nearly 30% of the population, significantly higher than Florida’s average.
- Concentrated in areas such as the Northside, Westside, and parts of Arlington.
- The community has deep historical roots, with cultural landmarks like LaVilla and the Ritz Theatre.
- The Black population has influenced Jacksonville’s music, cuisine, and civil rights history.
From Far East to First Coast: Jacksonville’s Growing Asian Communities
- Asians make up about 5% of the population, above the state average.
- Communities include Vietnamese, Indian, Chinese, and Filipino residents.
- Neighborhoods with growing Asian populations include Southside and parts of Arlington.
- The University of North Florida and local businesses have attracted many Asian professionals.
¡Hola, Jax!: The Vibrant Growth of Jacksonville’s Hispanic/Latino Population
- Hispanics/Latinos represent 11.6%, growing steadily from 7.7% in 2010.
- Predominantly Puerto Rican, Mexican, and Cuban heritage.
- Concentrated in areas like Arlington and parts of the urban core.
- Hispanic culture enriches Jacksonville’s festivals, restaurants, and bilingual services.
Echoes of the Past, Voices of Today: Native American and Other Populations in Jacksonville
- Native Americans and other groups make up about 1%.
- Many are descendants of local tribes or recent arrivals.
- Their presence is often less visible on maps but significant in cultural heritage and community organizations.
Blended Identities: The Rise of Multiracial Residents in Jacksonville
- Multiracial residents are about 4.6% of the population.
- This group reflects the increasing diversity and intermarriage trends.
- Multiracial communities are found citywide, often bridging cultural divides.
👶👵 Generations of Jax: Age Demographics and Their Impact on Community Life
Jacksonville’s age distribution shapes everything from schools to healthcare.
Age Breakdown Highlights
- Median age: 35.5 years, slightly younger than the national average.
- About 24% under 18, fueling demand for quality education.
- Growing senior population (65+) especially in Beaches and Mandarin areas.
Why Age Matters
- Younger populations drive school enrollment and family services.
- Older adults influence healthcare infrastructure and retirement communities.
- Age diversity contributes to vibrant neighborhoods with multi-generational activities.
💰 The Economic Landscape: Income Brackets and Wealth Distribution Across Jacksonville
Money talks, and Jacksonville’s economic map tells a story of contrasts.
Income Distribution Snapshot
- Median household income hovers around the national median.
- Wealthier neighborhoods include San Marco, Beaches, and parts of Southside.
- Lower-income areas often overlap with higher Black and Hispanic populations in Northside and Westside.
Economic Challenges and Opportunities
- Poverty rate around 14.3%, with pockets of concentrated need.
- Economic development efforts focus on job creation, especially in tech and healthcare sectors.
- Local initiatives aim to bridge income gaps through education and training.
🎓 Brains and the Beaches: Educational Attainment Across Duval County
Education levels vary widely across Jacksonville’s neighborhoods.
Key Stats
- About 30% hold a bachelor’s degree or higher.
- Higher education rates in Southside, Beaches, and parts of Arlington.
- Lower rates in some urban core neighborhoods.
Impact on the City
- Education influences job prospects, income, and community engagement.
- Jacksonville’s universities, like the University of North Florida and Jacksonville University, are hubs for growth and innovation.
For more on local education, check out our Jacksonville Education category.
👨 👩 👧 👦 Families, Singles, and Everything In Between: Household Structures in Jax
Jacksonville’s households are as diverse as its people.
Household Types
- 63% are family households.
- Average household size: 2.55 persons.
- Significant number of single-person households, especially among young professionals and seniors.
Neighborhood Variations
- Family-oriented neighborhoods: Mandarin, Beaches, and Southside.
- More singles and young adults in Downtown and Riverside.
🏠 Where We Live and How We Move: Housing Trends and Commuter Demographics
Housing and transportation patterns reveal a lot about Jacksonville’s lifestyle.
Housing Trends
- Mix of single-family homes, apartments, and condos.
- Growth in new developments in Southside and Arlington.
- Older housing stock in urban core neighborhoods.
Commuting Patterns
- Majority commute by car; Jacksonville’s sprawling geography makes public transit challenging.
- Average commute time around 26 minutes.
- Increasing interest in walkable neighborhoods and bike-friendly areas.
📍 Neighborhood by Neighborhood: A Deep Dive into Jacksonville’s Demographic Hotspots
Want the nitty-gritty? Here’s a snapshot of some key neighborhoods:
| Neighborhood | Dominant Demographic | Notable Features |
|---|---|---|
| San Marco | Predominantly White | Historic district, upscale dining |
| Northside | Predominantly Black | Affordable housing, cultural landmarks |
| Arlington | Mixed | Growing Hispanic and Asian populations |
| Beaches | Predominantly White | Coastal lifestyle, retirees |
| Riverside | Diverse | Arts district, young professionals |
📈 Growth Corridors and Changing Landscapes: Where Jacksonville is Expanding and Why
Jacksonville’s population is growing, but where?
- Southside and Arlington are hot spots for new housing and businesses.
- Urban core neighborhoods like Downtown and Riverside are attracting young professionals.
- The Beaches continue to draw retirees and tourists.
- Growth is driving infrastructure projects and city planning initiatives.
🏫🛍️ The Impact of Demographics on Local Life: From Schools to Shopping and Beyond
Demographics shape everyday life in Jacksonville.
- Schools adjust to changing student populations and language needs.
- Retailers tailor offerings to neighborhood demographics.
- Cultural festivals celebrate the city’s diversity.
- Public services adapt to age and income variations.
🔮 Planning Our Future: How Demographics Shape Jacksonville’s Development and Vision
City planners use demographic data to:
- Design equitable public services.
- Plan transportation and housing.
- Promote diversity and inclusion.
- Address climate challenges, like urban heat islands (see the featured video for insights on heat distribution).
📊 Navigating the Data: Where to Find Reliable Jacksonville Demographic Maps and Statistics
Looking to explore further? Here are our top picks:
- U.S. Census Bureau: data.census.gov — Official and comprehensive.
- Census Dots: censusdots.com — Visual racial dot maps.
- City of Jacksonville: coj.net — Local planning and ward maps.
- City-Data: city-data.com — Neighborhood stats and trends.
- University of North Florida Research: For studies like urban heat maps and demographic impacts.
Don’t miss the fascinating study by University of North Florida researchers revealing how urban heat varies across Jacksonville neighborhoods — a real-world example of how demographics and geography intersect to affect daily life.
Ready to dive deeper? Stay tuned for our conclusion and FAQs coming up next!
Conclusion: The Ever-Evolving Face of the River City

Well, there you have it — a panoramic, colorful, and detailed journey through Jacksonville’s demographics map! From the rich history that shaped our city’s population to the vibrant mosaic of cultures living here today, Jacksonville is a dynamic, evolving place where diversity is not just a statistic but a lived experience.
We’ve seen how the White population, while still the largest group, has declined over decades, making room for growing Black, Hispanic, Asian, and multiracial communities that add layers of culture, language, and life to Jax. The age distribution, economic landscape, and household structures all paint a picture of a city balancing tradition and growth, with neighborhoods that each tell their own unique story.
If you were wondering how to read those colorful demographic maps or why they matter beyond curiosity — now you know! These maps are powerful tools for city planners, businesses, and residents alike, helping to shape Jacksonville’s future in education, infrastructure, and community services.
So, next time you stroll through Riverside, hit the Beaches, or explore Arlington, remember: behind every street and block is a story told by the people who live there, reflected in the dots and colors of Jacksonville’s demographic map.
Ready to explore more? Dive into the resources below, and keep your curiosity alive about our ever-changing River City!
Recommended Links for Further Exploration
Looking to deepen your understanding or gift a friend interested in urban demographics? Check out these top picks:
-
Books on Urban Demographics and Diversity:
- The Color of Law by Richard Rothstein — A deep dive into how government policies shaped racial segregation:
Amazon Link - Diversity Explosion by William H. Frey — Explores demographic changes across America, including cities like Jacksonville:
Amazon Link
- The Color of Law by Richard Rothstein — A deep dive into how government policies shaped racial segregation:
-
Interactive Demographic Maps and Data Tools:
FAQ: Your Burning Questions About Jacksonville Demographics Answered

Where can I find an interactive demographic map of Jacksonville?
You can explore interactive demographic maps on several platforms:
- Census Dots offers a visually engaging racial dot map of Jacksonville: censusdots.com.
- The U.S. Census Bureau’s data portal (data.census.gov) provides customizable maps and data tables.
- The City of Jacksonville’s Planning and Development Department website (coj.net) offers ward maps and planning documents with demographic overlays.
These tools allow you to zoom into neighborhoods, filter by race, age, income, and more, making them invaluable for research or curiosity.
What is the racial and ethnic composition of Jacksonville Florida?
According to the 2020 Census:
- White (non-Hispanic): 47.8%
- Black or African American: 29.9%
- Hispanic or Latino (any race): 11.6%
- Asian: 5.0%
- Native American/Other: 1.0%
- Multiracial: 4.6%
This composition reflects Jacksonville’s diverse and evolving population, with significant Black and Hispanic communities alongside a growing Asian presence.
How does the population density vary across Jacksonville neighborhoods?
Population density in Jacksonville varies widely due to its sprawling geography:
- Urban core neighborhoods like Downtown, Riverside, and Springfield have higher population densities, with more apartments and mixed-use development.
- Suburban areas such as Mandarin and Southside feature lower density, predominantly single-family homes.
- The Beaches area combines moderate density with a mix of retirees and seasonal residents.
- Density patterns often correlate with demographic clusters, economic status, and housing types.
What are the key demographic trends in Jacksonville Florida?
Key trends include:
- Increasing diversity: Growth in Hispanic, Asian, and multiracial populations.
- Declining White non-Hispanic share: From over 75% in 1970 to under 50% in 2020.
- Stable Black population: Around 30%, with strong cultural roots.
- Population growth: The city has grown over 6% since 2020, with expanding suburbs.
- Younger median age: Around 35.5 years, supporting a dynamic workforce.
What is the average household income in Jacksonville?
The median household income in Jacksonville is close to the national median, with notable variation:
- Wealthier neighborhoods like San Marco and Beaches have incomes well above the median.
- Areas such as Northside and Westside tend to have lower median incomes.
- The city’s poverty rate hovers around 14.3%, highlighting pockets of economic need.
What are the demographics of North Jacksonville?
North Jacksonville is predominantly African American, with a significant Black population often exceeding 50% in many neighborhoods. It features a mix of residential and commercial areas, with affordable housing and strong community institutions. The area has a rich cultural heritage but also faces economic challenges that city initiatives aim to address.
How does the population distribution vary across Jacksonville neighborhoods?
Population distribution reflects historical settlement, economic factors, and urban development:
- White populations concentrate in affluent suburbs and coastal areas.
- Black populations are more concentrated in Northside, Westside, and parts of Arlington.
- Hispanic and Asian populations are growing in Arlington, Southside, and urban neighborhoods.
- Multiracial residents are dispersed but increasing citywide.
Where can I find ward maps and political boundaries for Jacksonville?
For residents interested in political districts and civic engagement, the City of Jacksonville provides official ward maps:
- Visit the City of Jacksonville Planning and Development Ward Maps for detailed, interactive maps.
- For Jacksonville, North Carolina (not Florida), check the official Ward Maps | Jacksonville, NC – Official Website.
These maps are essential for understanding voting districts and community representation.
Reference Links: Our Sources for Jax Facts™
- U.S. Census Bureau — https://www.census.gov/programs-surveys/decennial-census/about/rdo.html
- Census Dots Jacksonville Demographics — https://www.censusdots.com/race/jacksonville-fl-demographics
- City of Jacksonville Official Site — https://www.coj.net
- City-Data Jacksonville Profile — https://www.city-data.com/city/Jacksonville-Florida.html
- Wikipedia Jacksonville, Florida — https://en.wikipedia.org/wiki/Jacksonville,_Florida
- Jacksonville, NC Ward Maps — https://www.jacksonvillenc.gov/95/Ward-Maps